1 Introduction to Power BI
1.1 Overview of Business Intelligence and Data Visualization
In today’s data-driven world, businesses and organizations generate massive amounts of data from multiple sources such as transactions, customer interactions, social media, and sensors. However, raw data in itself holds little value unless it is properly processed, analyzed, and visualized to extract meaningful insights. This is where Business Intelligence (BI) and data visualization play a critical role.
1.1.1 What is Business Intelligence?
Business Intelligence (BI) refers to the process of collecting, processing, analyzing, and presenting business data to support decision-making. It involves a combination of tools, methodologies, and strategies to transform raw data into useful information that helps organizations make informed decisions.
Key Components of Business Intelligence:
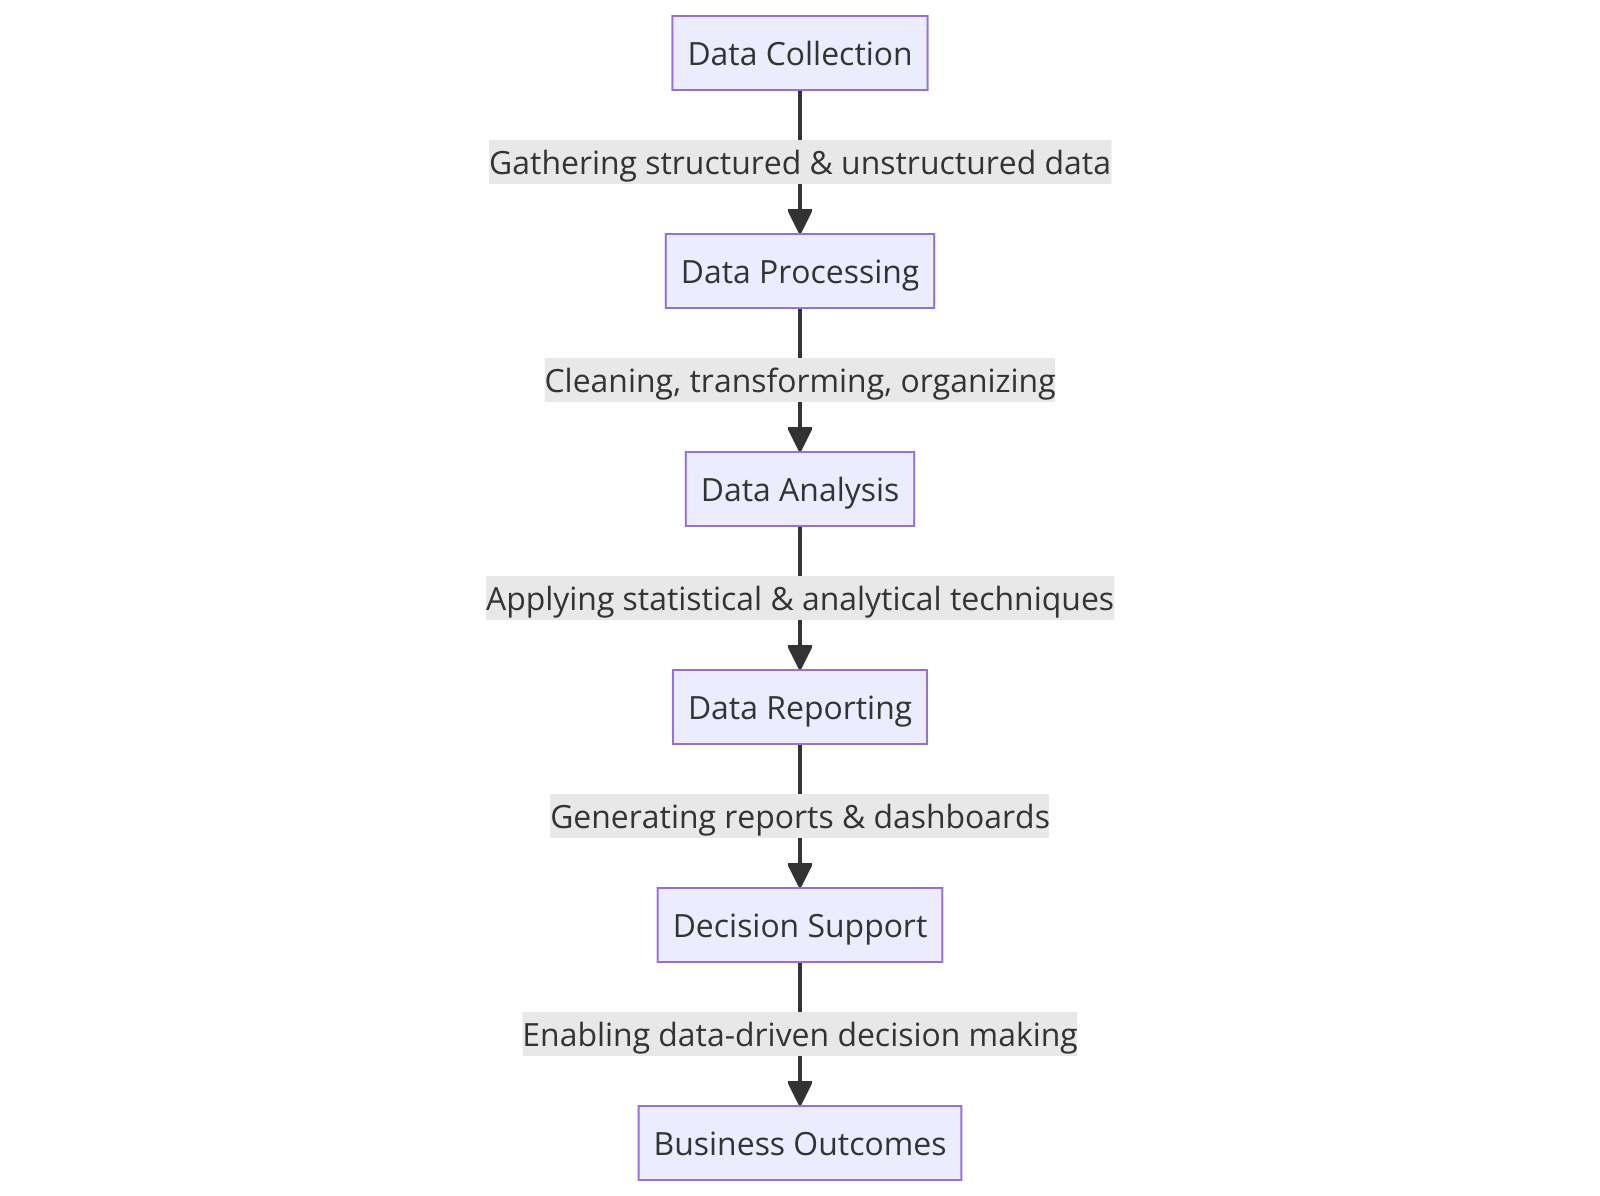
- Data Collection: Gathering structured and unstructured data from various internal and external sources.
- Data Processing: Cleaning, transforming, and organizing data for accurate analysis.
- Data Analysis: Applying statistical and analytical techniques to extract trends, patterns, and correlations.
- Data Reporting: Generating reports and dashboards to visualize key metrics and insights.
- Decision Support: Enabling data-driven decision-making based on actionable intelligence.
1.1.2 Importance of Data Visualization
Data visualization is the graphical representation of information and data. By using visual elements such as charts, graphs, and maps, data visualization helps in making complex data more understandable and accessible to a wide audience.
Benefits of Data Visualization:
- Enhances Data Interpretation: Graphical representations make it easier to identify patterns, trends, and correlations.
- Facilitates Faster Decision-Making: Visual data allows decision-makers to quickly grasp key insights and take timely actions.
- Identifies Anomalies and Outliers: Helps in detecting unexpected trends or inconsistencies in the data.
- Improves Communication: Enables better storytelling and presentation of insights to stakeholders.
- Encourages Data Exploration: Interactive visualizations allow users to drill down into data and uncover deeper insights.
1.1.3 Types of Data Visualization
Depending on the nature of data and the insights required, various types of data visualizations are used in BI:
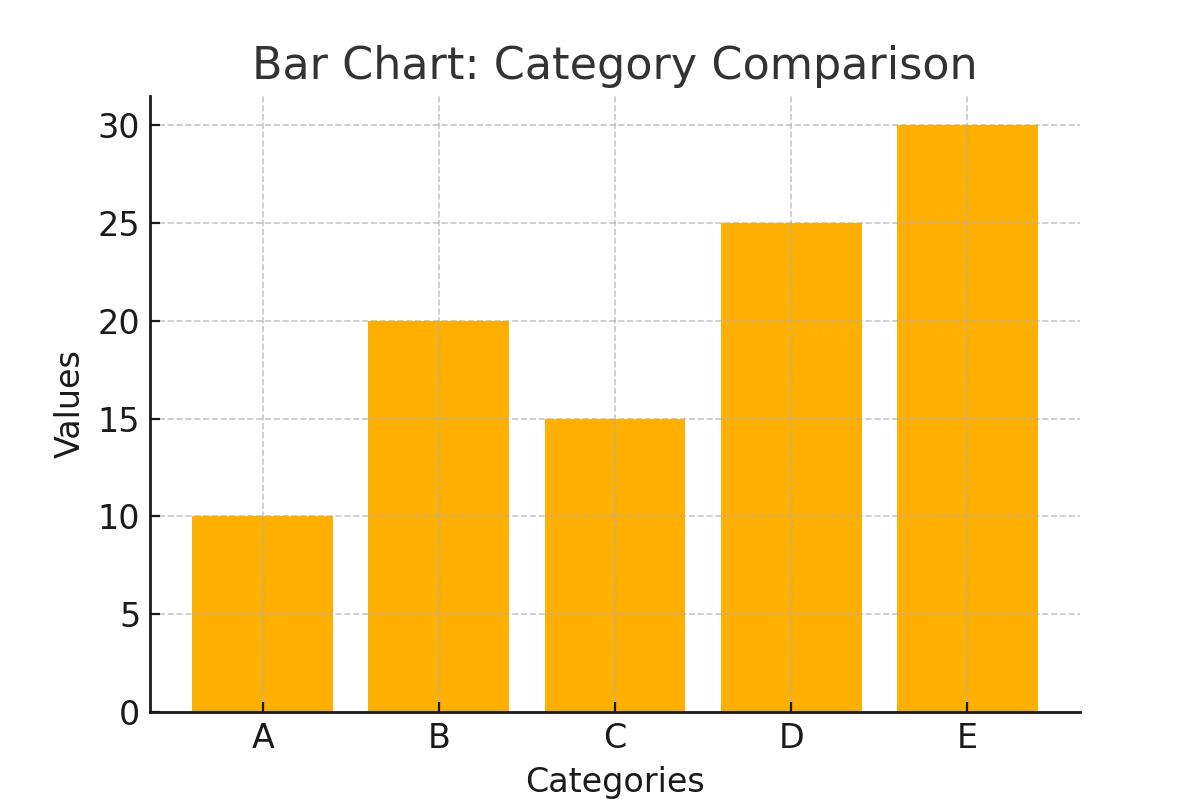
Bar Charts
Bar charts are one of the most commonly used visualizations in data analysis. They are used to compare different categories of data by representing them as rectangular bars. The length or height of each bar is proportional to the value it represents.
Use Cases:
- Comparing sales performance across different regions.
- Analyzing customer feedback ratings.
- Displaying revenue comparisons over time.
Types of Bar Charts:
- Vertical Bar Charts: Bars are aligned vertically, useful for showing trends over time.
- Horizontal Bar Charts: Bars are aligned horizontally, useful for ranking comparisons.
- Stacked Bar Charts: Used to show the proportion of subcategories within a main category.
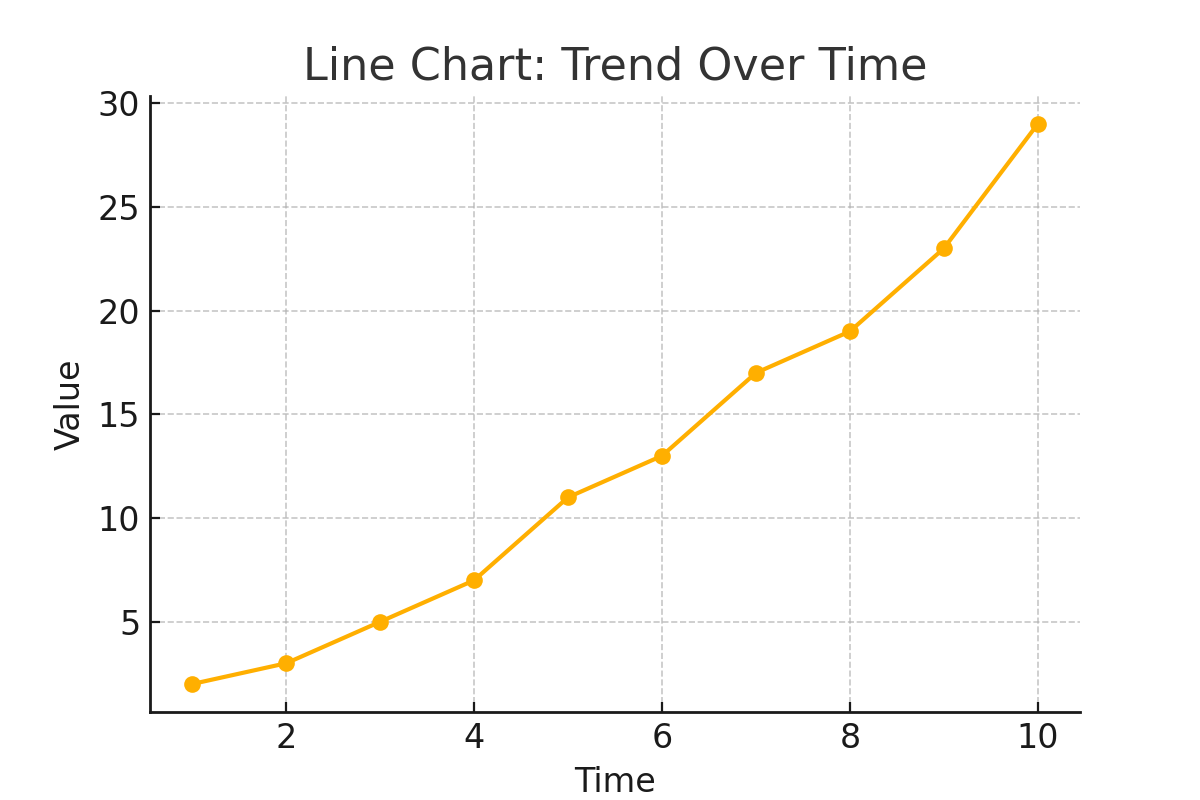
Line Charts
Line charts are used to display trends over time. They consist of a series of points connected by a continuous line, making it easy to identify patterns and fluctuations in data.
Use Cases:
- Tracking stock market performance.
- Monitoring website traffic over weeks or months.
- Analyzing temperature variations across seasons.
Key Benefits:
- Ideal for showing trends and forecasting future performance.
- Can compare multiple data series simultaneously.
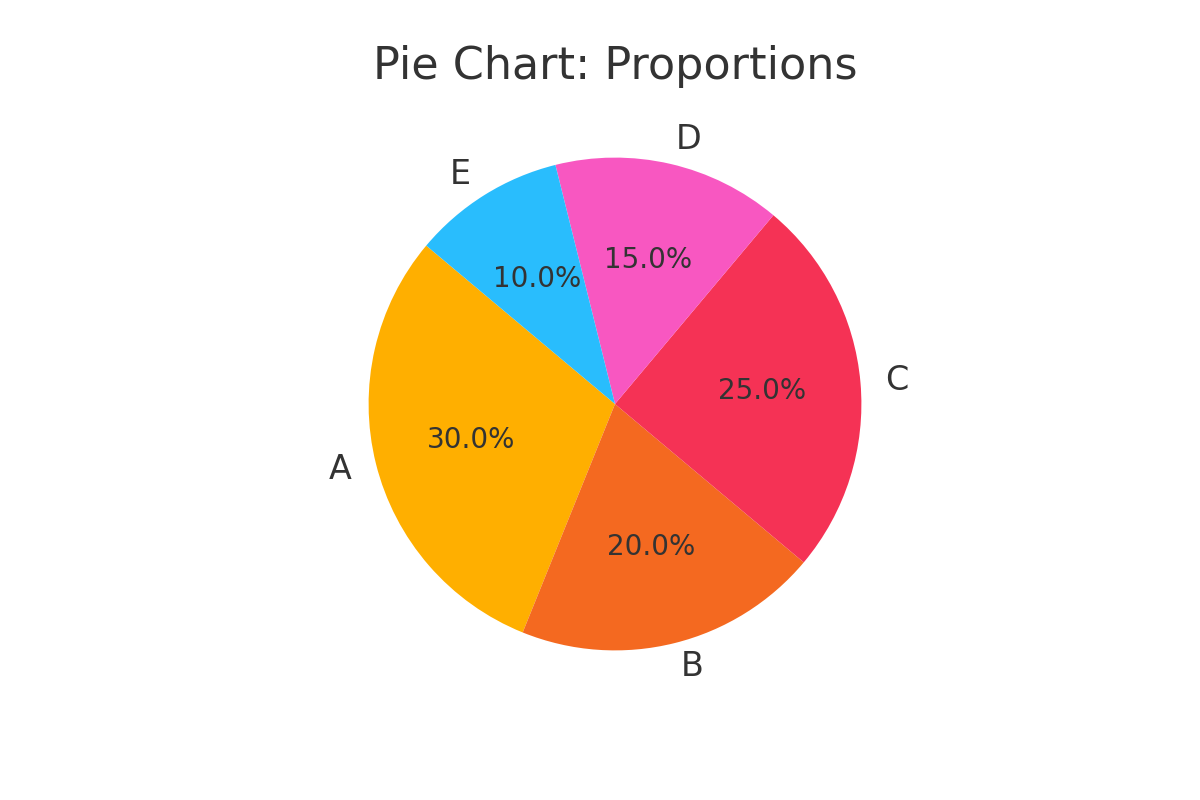
Pie Charts
A pie chart is a circular chart divided into slices to represent proportions of a whole dataset. Each slice’s size is proportional to its percentage of the total.
Use Cases:
- Displaying the market share of different companies.
- Showing budget allocation across departments.
- Illustrating customer distribution by demographic.
Limitations:
- Not ideal for comparing precise values.
- Can become cluttered with too many categories.
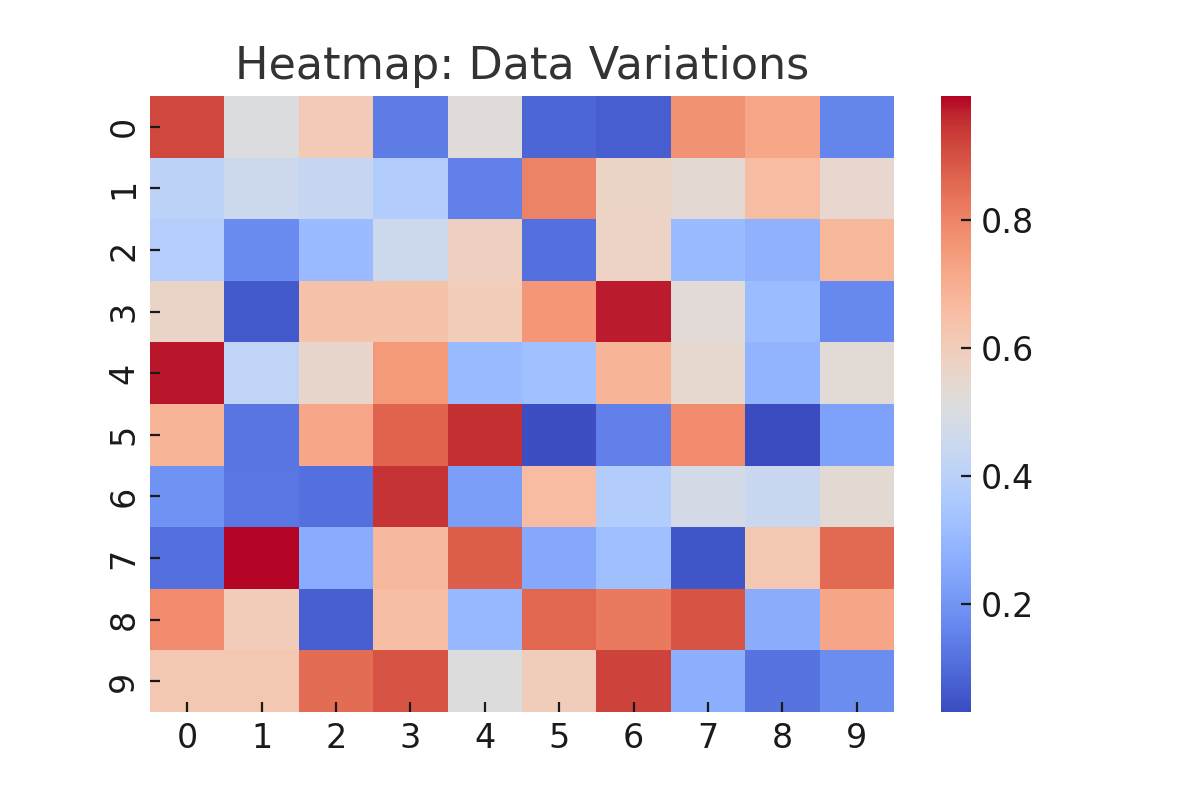
Heatmaps
Heatmaps use color gradients to represent variations in data intensity. They are useful for identifying patterns and trends across large datasets.
Use Cases:
- Analyzing website user activity (hotspots where users click the most).
- Displaying correlation matrices in statistical analysis.
- Tracking real-time sales performance across multiple locations.
Key Benefits:
- Helps in identifying high and low-value data points quickly.
- Effective for showing relationships between variables.
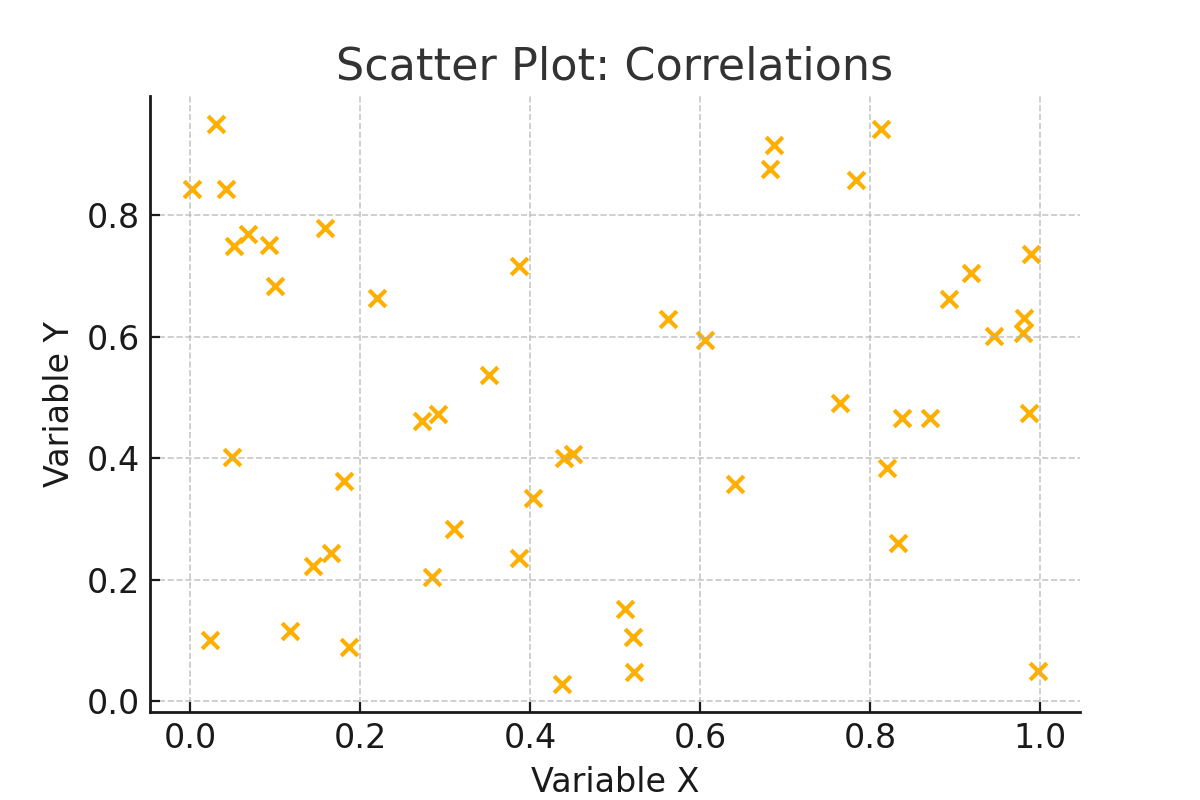
Scatter Plots
A scatter plot is used to display the relationship between two numerical variables. Each point on the graph represents an observation with values for two variables plotted along the x and y axes.
Use Cases:
- Examining the relationship between advertising spend and sales revenue.
- Identifying clusters and anomalies in customer data.
- Comparing the correlation between employee productivity and working hours.
Key Benefits:
- Highlights correlations and patterns in data.
- Useful for detecting outliers.
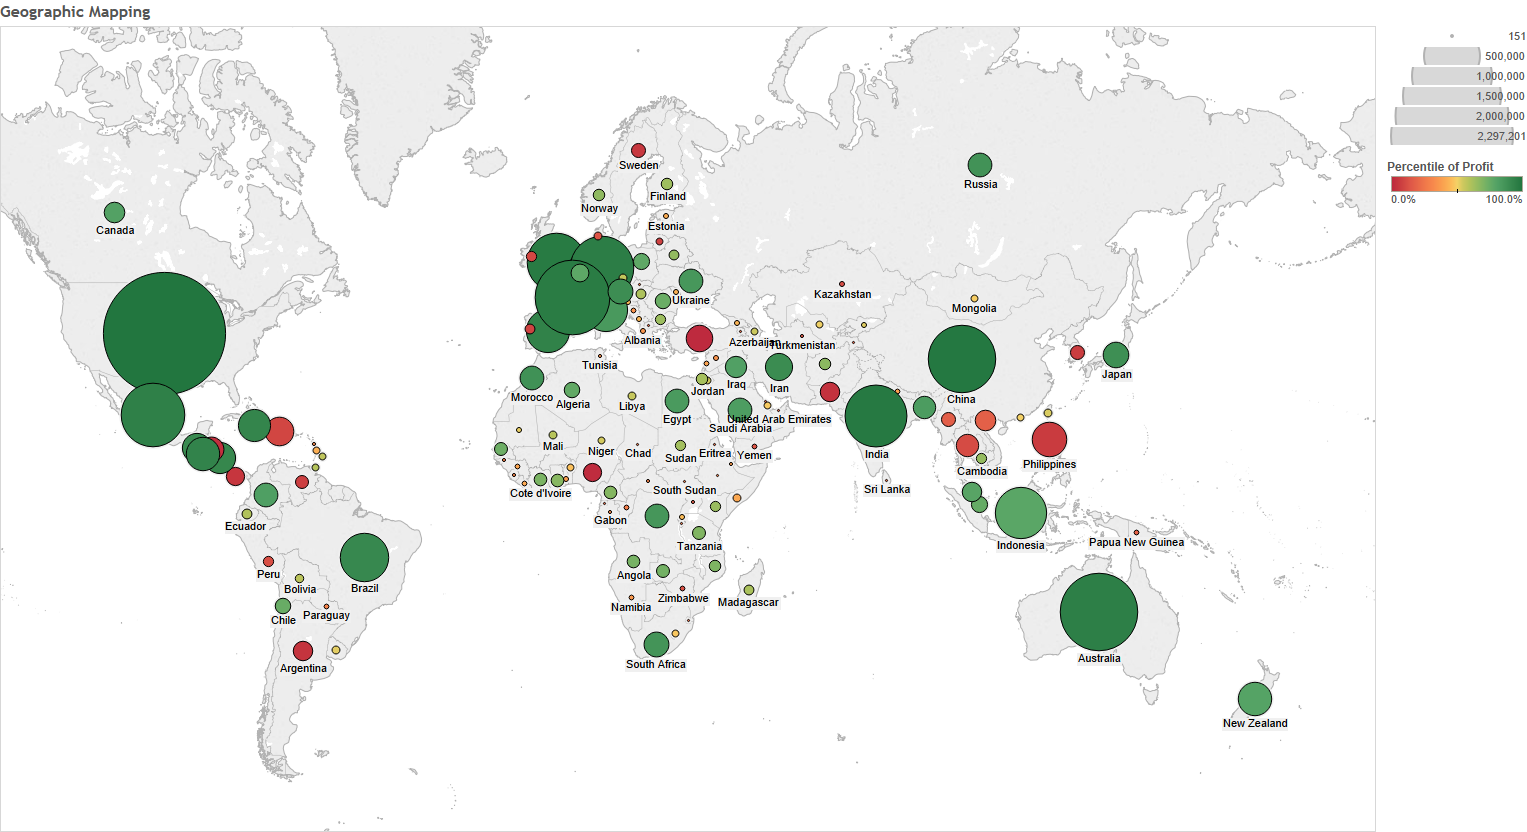
Geographical Maps
Geographical maps are used to visualize data based on locations. They display information using color shading, bubbles, or markers on a map.
Use Cases:
- Representing population density across different countries.
- Analyzing sales performance by geographical region.
- Tracking the spread of diseases in epidemiological studies.
Types of Geographical Maps:
- Choropleth Maps: Use color gradients to represent values across different regions.
- Bubble Maps: Represent data points as bubbles varying in size based on the metric being analyzed.
- Heat Maps: Display intensity variations on a map.
1.2 Introduction to Power BI: Components and Workflow
1.2.1 Introduction to Power BI
Power BI is a business analytics tool developed by Microsoft that allows users to visualize data and share insights across an organization. It enables data professionals, business analysts, and decision-makers to create interactive dashboards and reports, bringing data to life through powerful visualizations and insights.
Power BI simplifies complex data, making it accessible and actionable for non-technical users. It integrates with various data sources, offering a robust platform for business intelligence and analytics.
1.2.2 Key Features of Power BI
Interactive Dashboards Power BI dashboards are highly interactive, enabling users to drill down into data, filter information, and customize views in real-time.
Wide Range of Visualizations Power BI offers a variety of visualization types, such as bar charts, scatter plots, line charts, heat maps, and more, to suit different analytical needs.
Integration with Multiple Data Sources
Users can connect to numerous data sources, including Excel, SQL Server, SharePoint, cloud platforms like Azure, and online services such as Google Analytics and Salesforce.Data Modeling
With its built-in data modeling capabilities, Power BI allows users to clean, transform, and structure raw data for analysis.Real-Time Analytics
Power BI supports real-time data streaming, enabling organizations to monitor key metrics and trends in real-time.AI-Powered Insights
Leveraging Microsoft’s AI capabilities, Power BI provides advanced analytics, natural language queries, and predictive modeling.Mobile Access
Power BI offers apps for mobile devices, ensuring accessibility to dashboards and reports anytime, anywhere.Collaborative Sharing
Users can publish and share reports and dashboards through Power BI Service, fostering collaboration within teams.
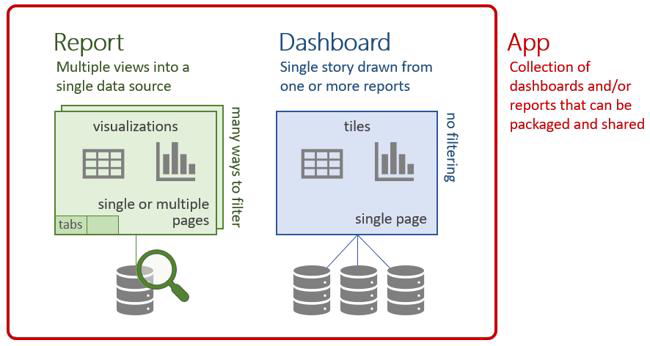
1.2.3 Reports, Dashboards, and Apps
1.2.4 Power BI Architecture
The architecture of Power BI consists of multiple components that work together to ensure seamless data integration, processing, and visualization. The image illustrates the key components of Power BI architecture and their interactions.
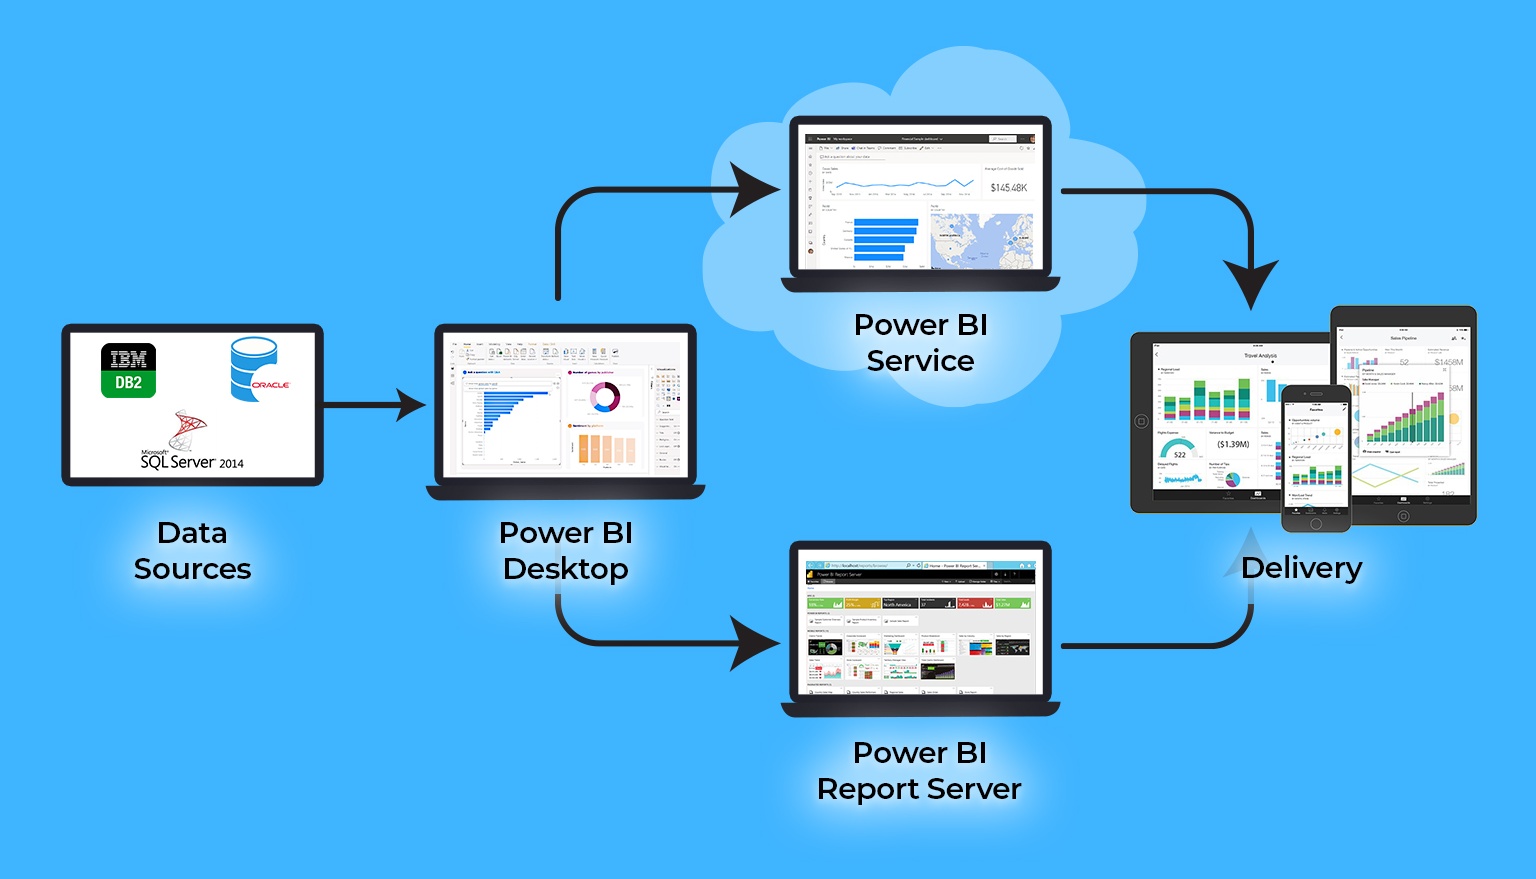
1. Data Sources
Power BI can connect to a variety of data sources, including:
-
Relational Databases: SQL Server, IBM DB2, Oracle, MySQL
-
Cloud-based Data Services: Azure SQL Database, Google BigQuery, Amazon Redshift
-
Flat Files: Excel, CSV, XML, JSON
- Online Services: Google Analytics, Salesforce, SharePoint
Data from these sources is imported or connected live to Power BI for processing and visualization.
2. Power BI Desktop
Power BI Desktop is the primary tool used for:
-
Data Preparation: Importing and cleaning data using Power Query
-
Data Modeling: Defining relationships between tables and creating calculated measures using DAX
- Visualization: Designing interactive reports and dashboards with charts, tables, and maps
Once the report is created in Power BI Desktop, it can be published to the Power BI Service or Power BI Report Server.
3. Power BI Service
Power BI Service is a cloud-based platform where users can:
-
Publish and share reports with stakeholders
-
Schedule automatic data refresh to ensure real-time updates
- Collaborate and manage access using row-level security and permission controls
This allows teams to access Power BI reports from anywhere with an internet connection.
4. Power BI Report Server
For organizations that require on-premise reporting solutions, Power BI Report Server is used. It allows:
-
Hosting and managing Power BI reports within a private infrastructure
-
Accessing reports via a web browser without requiring cloud storage
- Integrating with SQL Server Reporting Services (SSRS) for traditional paginated reports
This component is ideal for enterprises with strict data security and compliance requirements.
5. Delivery and Accessibility
Power BI supports multiple devices for report delivery, including:
-
Web Browsers: Accessing reports via Power BI Service
-
Mobile Apps: Available for iOS and Android, allowing users to interact with reports on the go
- Embedded Applications: Power BI reports can be integrated into other business applications
1.2.5 Applications of Power BI
1. Business Intelligence and Reporting
Power BI is widely used for business intelligence and reporting purposes. Organizations utilize Power BI to collect, analyze, and visualize data, enabling them to make informed decisions. With its interactive dashboards, companies can track key performance indicators (KPIs) and business trends.
Use Cases:
- Performance monitoring across different departments.
- Financial analysis and forecasting.
- Sales and revenue tracking.
2. Financial Analysis and Budgeting
Power BI is a valuable tool for financial analysts and accountants. It helps in analyzing revenue trends, tracking expenses, and forecasting financial performance.
Use Cases:
- Budget planning and allocation.
- Financial statement analysis.
- Identifying cost-saving opportunities.
3. Sales and Marketing Analytics
Marketing and sales teams leverage Power BI to analyze campaign performance, track customer behavior, and monitor sales trends.
Use Cases:
- Customer segmentation and targeting.
- Conversion rate analysis.
- Sales performance tracking.
4. Supply Chain and Inventory Management
Power BI enables supply chain professionals to optimize operations by analyzing inventory levels, supplier performance, and demand forecasts.
Use Cases:
- Real-time inventory tracking.
- Demand and supply forecasting.
- Supplier performance evaluation.
5. Human Resources and Workforce Analytics
HR departments use Power BI to analyze employee performance, monitor workforce engagement, and track recruitment trends.
Use Cases:
- Employee attrition and retention analysis.
- Workforce diversity and inclusion tracking.
- Training and development impact assessment.
6. Healthcare and Patient Analytics
Healthcare organizations use Power BI to analyze patient data, optimize hospital operations, and track disease trends.
Use Cases:
- Patient diagnosis and treatment analysis.
- Hospital resource management.
- Disease outbreak tracking and prevention.
7. Retail and E-Commerce Analytics
Retail businesses use Power BI to track customer preferences, analyze sales patterns, and optimize inventory.
Use Cases:
- Customer purchase behavior analysis.
- In-store and online sales performance tracking.
- Pricing strategy optimization.
8. Agriculture Analytics
The agriculture industry benefits from Power BI by analyzing crop yields, weather patterns, soil health, and supply chain logistics.
Use Cases:
- Precision farming through real-time sensor data analysis.
- Monitoring soil moisture and nutrient levels.
- Analyzing market demand for agricultural products.
- Tracking supply chain logistics for farm produce.
9. Government and Public Sector Analytics
Government agencies use Power BI for public data analysis, resource allocation, and policy evaluation.
Use Cases:
- Crime trend analysis.
- Budget allocation tracking.
- Public service impact assessment.
10. IT and Software Development Analytics
IT professionals and software companies use Power BI to track system performance, monitor cybersecurity threats, and improve project management.
Use Cases:
- Software performance and bug tracking.
- IT security threat analysis.
- Project management and resource allocation.
1.2.6 Key Components of Power BI
Power BI consists of several key components, each serving a distinct function in the data analysis and visualization process:
1. Power BI Desktop
- A free, standalone Windows application used for creating reports and dashboards.
- Allows users to connect to various data sources, clean and transform data, build relationships, and design visualizations.
- Supports advanced calculations using DAX (Data Analysis Expressions).
2. Power BI Service (Cloud-Based)
- A cloud-based service where users can publish, share, and collaborate on reports and dashboards.
- Provides real-time data refresh capabilities and security features such as row-level security (RLS).
- Enables access to Power BI reports from anywhere with an internet connection.
3. Power BI Mobile
- Mobile applications available for iOS and Android devices.
- Allows users to access and interact with Power BI reports and dashboards on the go.
- Supports push notifications for real-time data updates.
4. Power Query
- A powerful ETL (Extract, Transform, Load) tool used for data transformation and preparation.
- Allows users to clean, merge, and manipulate data from multiple sources.
- Integrated into Power BI Desktop to facilitate data preprocessing.
5. Power Pivot
- A data modeling tool that helps users create relationships between different data tables.
- Supports the use of DAX for creating calculated columns and measures.
- Enhances performance when working with large datasets.
6. Power BI Report Builder
- A tool used for creating paginated reports optimized for printing and document sharing.
- Supports detailed and structured reporting, such as invoices and balance sheets.
7. Power BI Embedded
- Allows developers to integrate Power BI reports and dashboards into custom applications.
- Provides API access to embed analytics into web applications.
1.2.7 Power BI Workflow
The Power BI workflow consists of several key steps that guide users from data acquisition to insight generation:
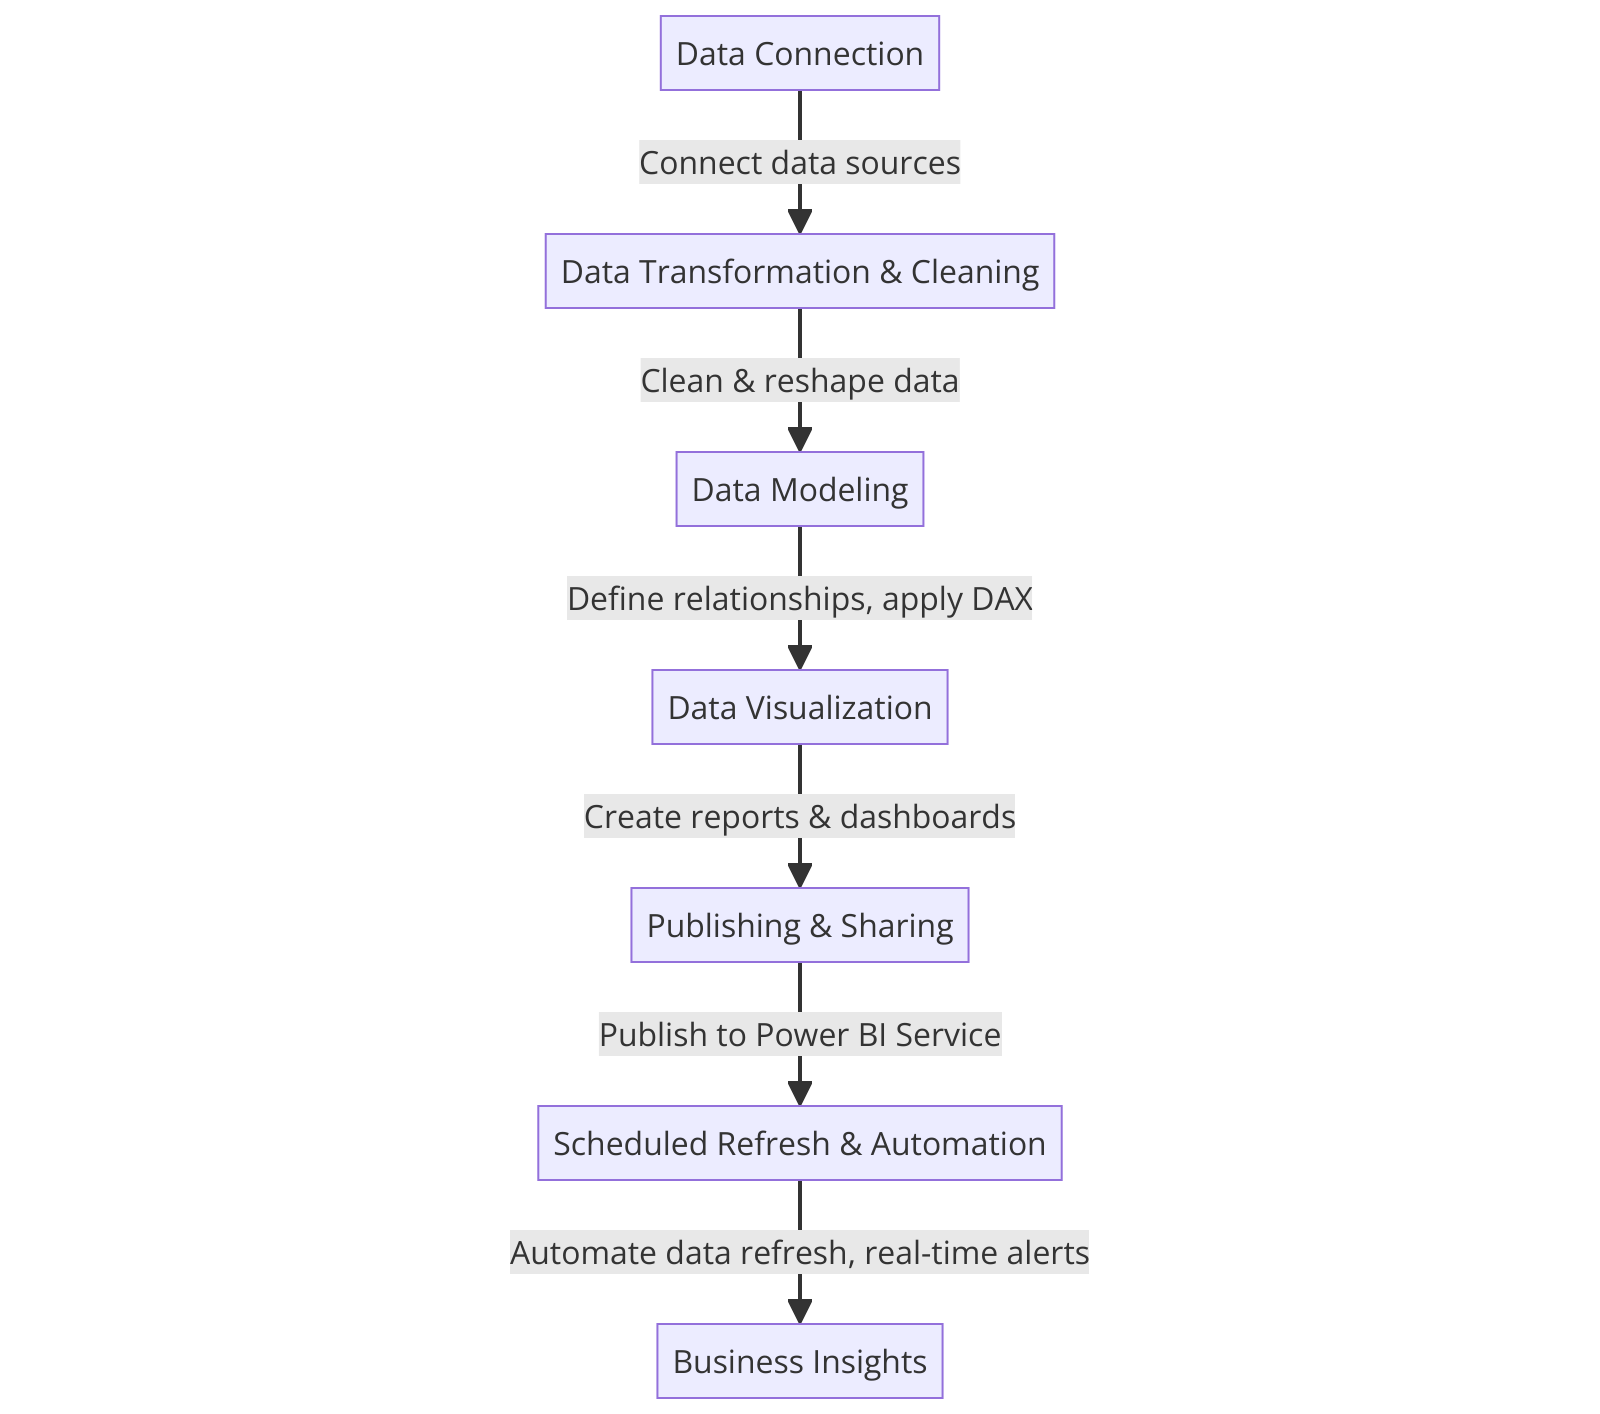
1. Data Connection
- Power BI supports a wide range of data sources, including Excel, SQL Server, cloud services, APIs, and online databases.
- Users connect their desired data source to Power BI for analysis and visualization.
2. Data Transformation and Cleaning
- Power Query is used to clean and reshape data before visualization.
- Users can remove duplicates, filter records, replace missing values, and perform data transformations.
3. Data Modeling
- Relationships between tables are created to define data structures.
- Users can apply DAX formulas to build calculated columns, measures, and aggregations.
- Hierarchies are set up to enable drill-down analysis.
4. Data Visualization
- Users build interactive reports and dashboards using visual elements such as bar charts, line graphs, pie charts, maps, and key performance indicators (KPIs).
- Filters, slicers, and tooltips enhance user interaction and data exploration.
5. Publishing and Sharing
- Reports and dashboards can be published to the Power BI Service for collaboration.
- Permissions and security settings can be configured to control data access.
- Users can share insights with stakeholders via web links or embedded dashboards.
6. Scheduled Refresh and Automation
- Power BI allows users to schedule automatic data refresh to keep reports updated.
- Real-time dashboards and alerts can be set up to monitor key business metrics.
1.3 Installing and Setting Up Power BI Desktop
Power BI Desktop is a free application that allows users to connect, transform, and visualize data. Follow these step-by-step instructions to download and install Power BI Desktop on your PC.
Step 1: Check System Requirement
Before installing Power BI Desktop, ensure your PC meets the following minimum requirements:
- Operating System: Windows 10 or later
- Processor: 1.6 GHz or faster
- RAM: 4 GB (8 GB recommended)
- Disk Space: At least 2 GB available
Step 2: Download Power BI Desktop
- Open your web browser and go to the official Microsoft Power BI download page:
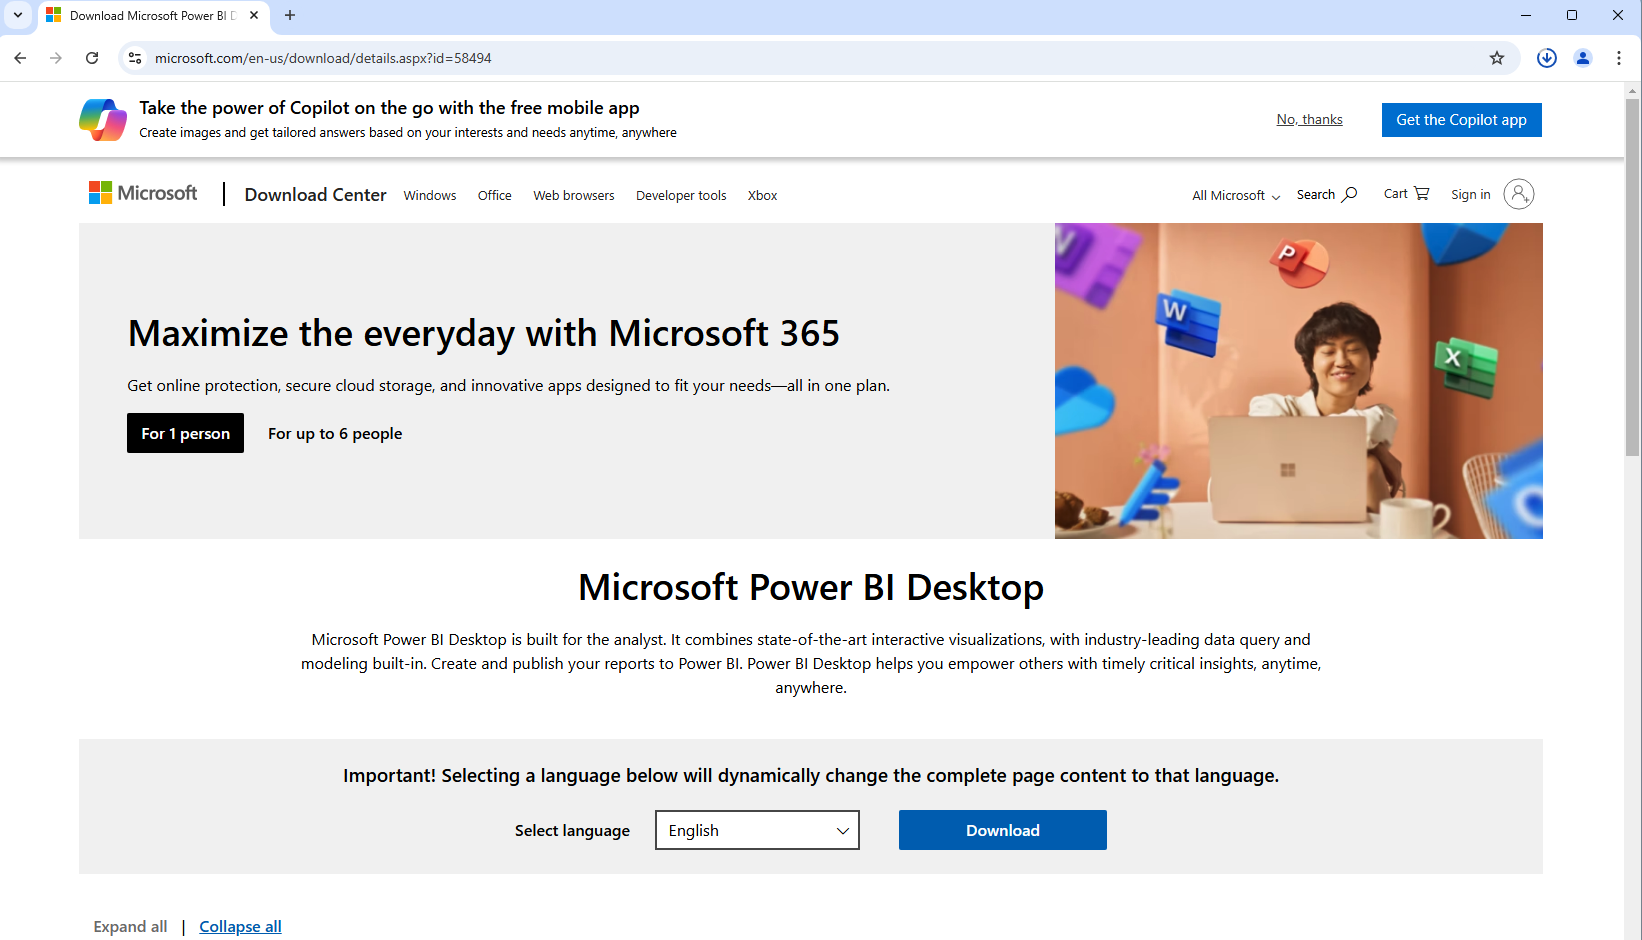 2. Click on Download under the “Power BI Desktop” section.
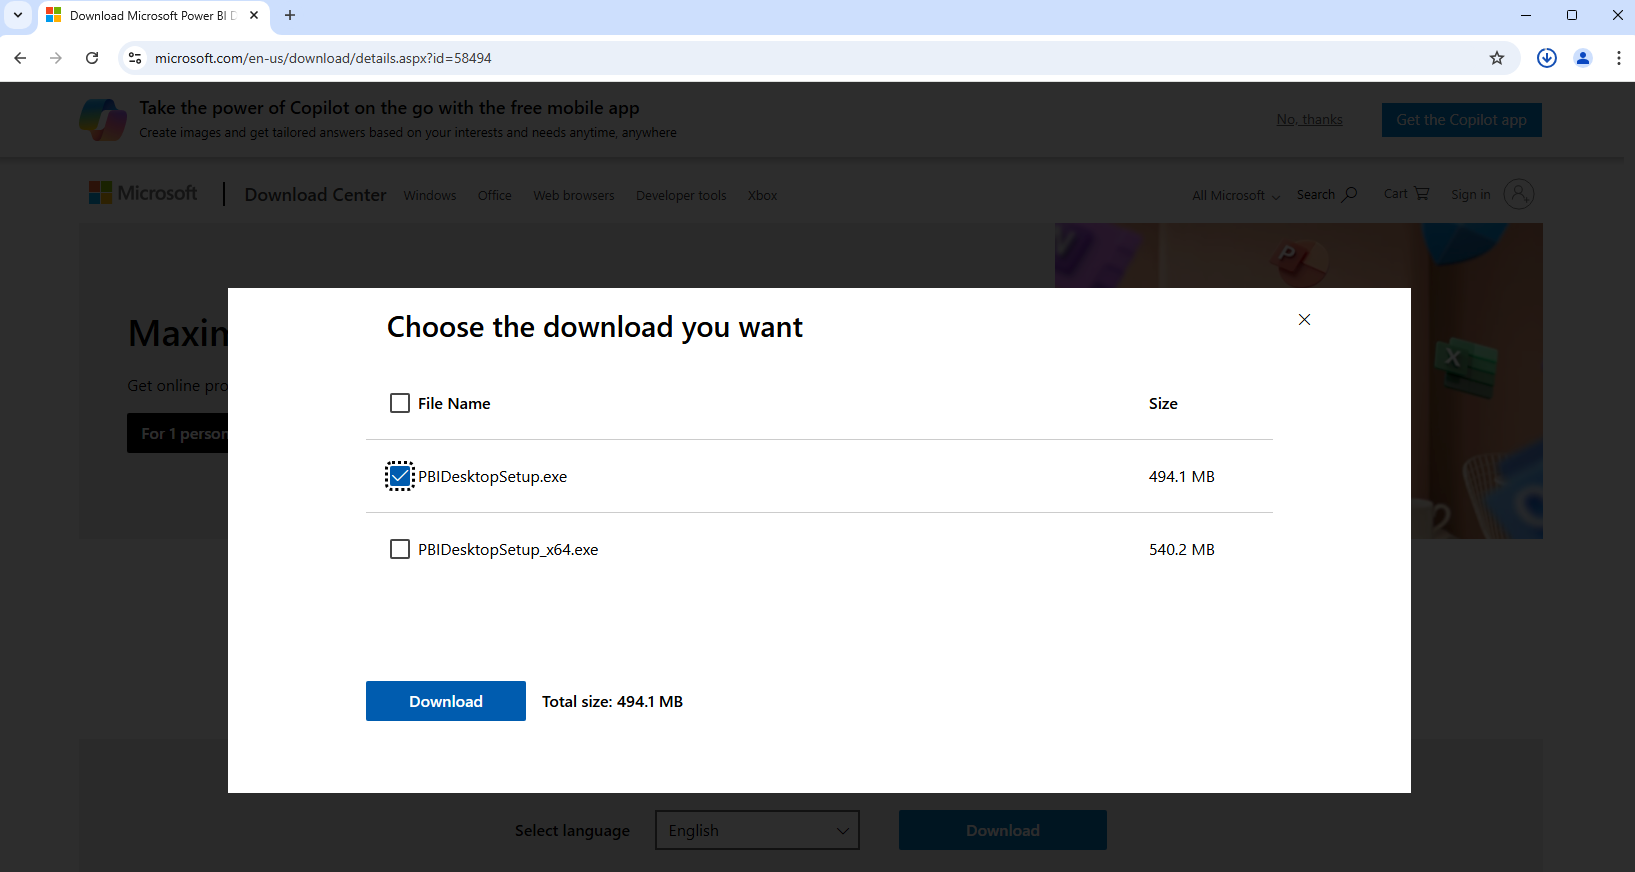
Select PBIDesktopsetup.exe and click download.
Note: If your PC is 64bit, then you have an option to choose PBIDesktopsetup_X64.exe and click download.
Step 3: Install Power BI Desktop
- Once the download is complete, locate the .exe installation file in your Downloads folder.
- Double-click the file to launch the installation wizard.
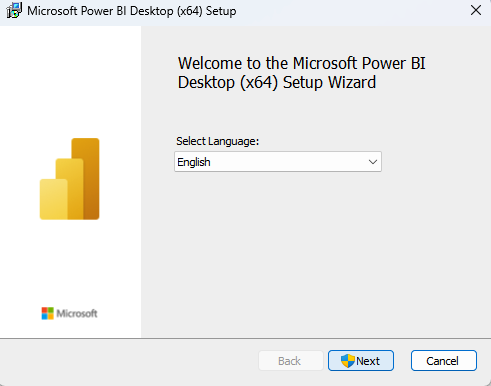
- Follow the on-screen instructions:
- Click Next to proceed.
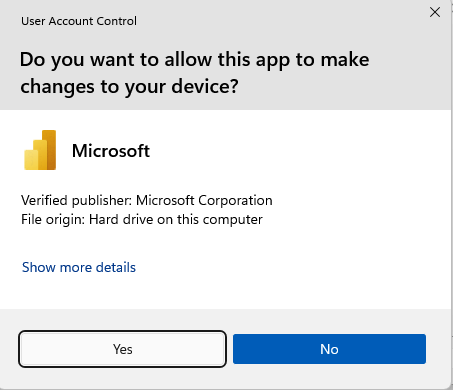
Click on Yes
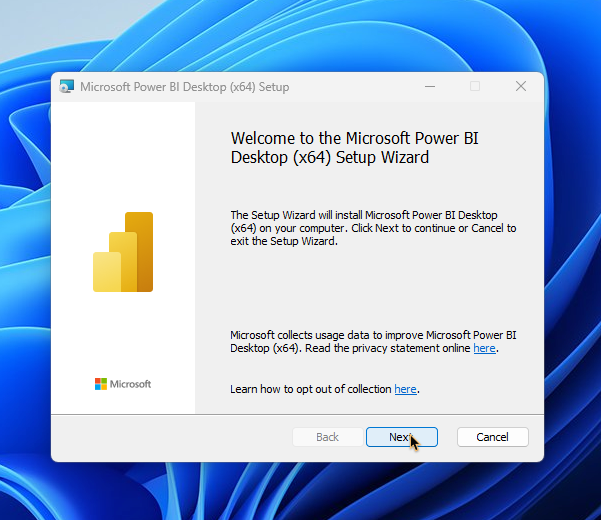 - Click Next to proceed.
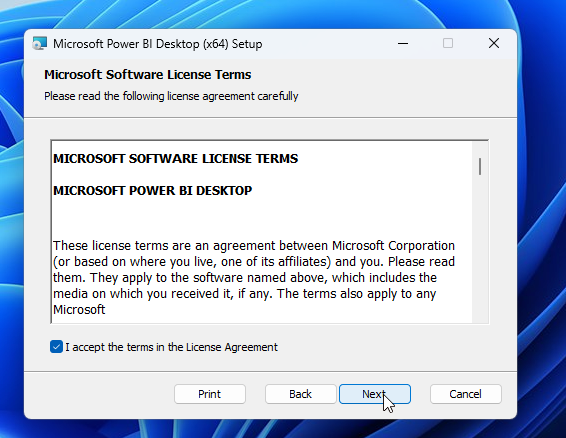
- Accept the license agreement and Click Next to proceed.
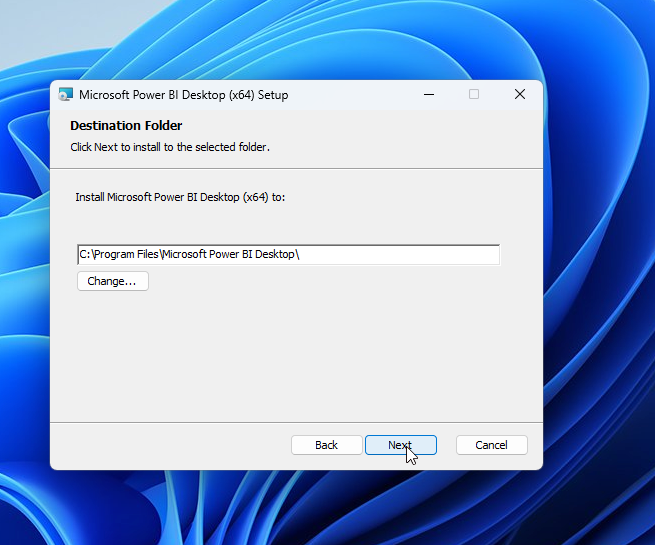
- Choose the installation location (default is recommended) and click Yes.
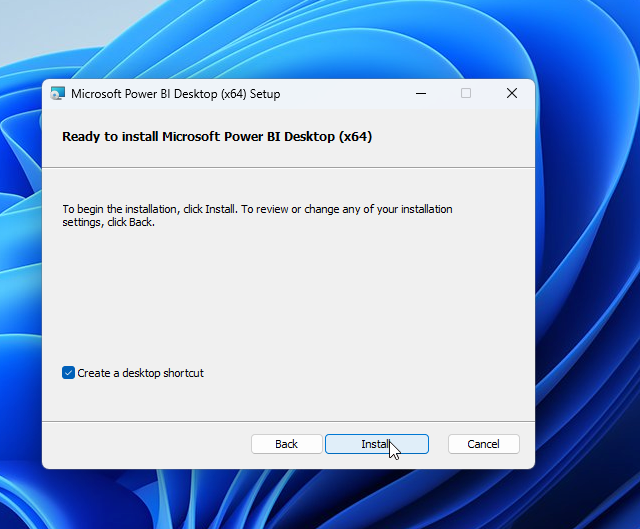
- click create desktop shortcut and click install to begin the installation process.
- Wait for the installation to complete.
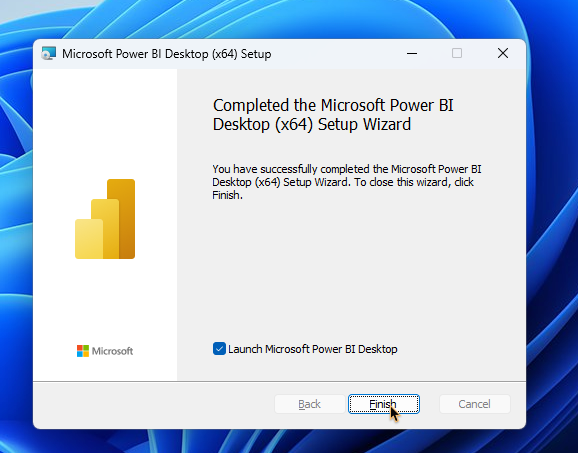
click launch power bi desktop and and then click Finish
Step 4: Launch Power BI Desktop
- Go to the Start Menu and search for Power BI Desktop.
- Click on the application to open it.
You’re now ready to start using Power BI Desktop 🥳
1.4 Navigating the Power BI Interface
Power BI provides an intuitive and user-friendly interface designed to help users seamlessly create reports, analyze data, and generate insights. Understanding its interface is essential for effectively using Power BI for data visualization and business intelligence.
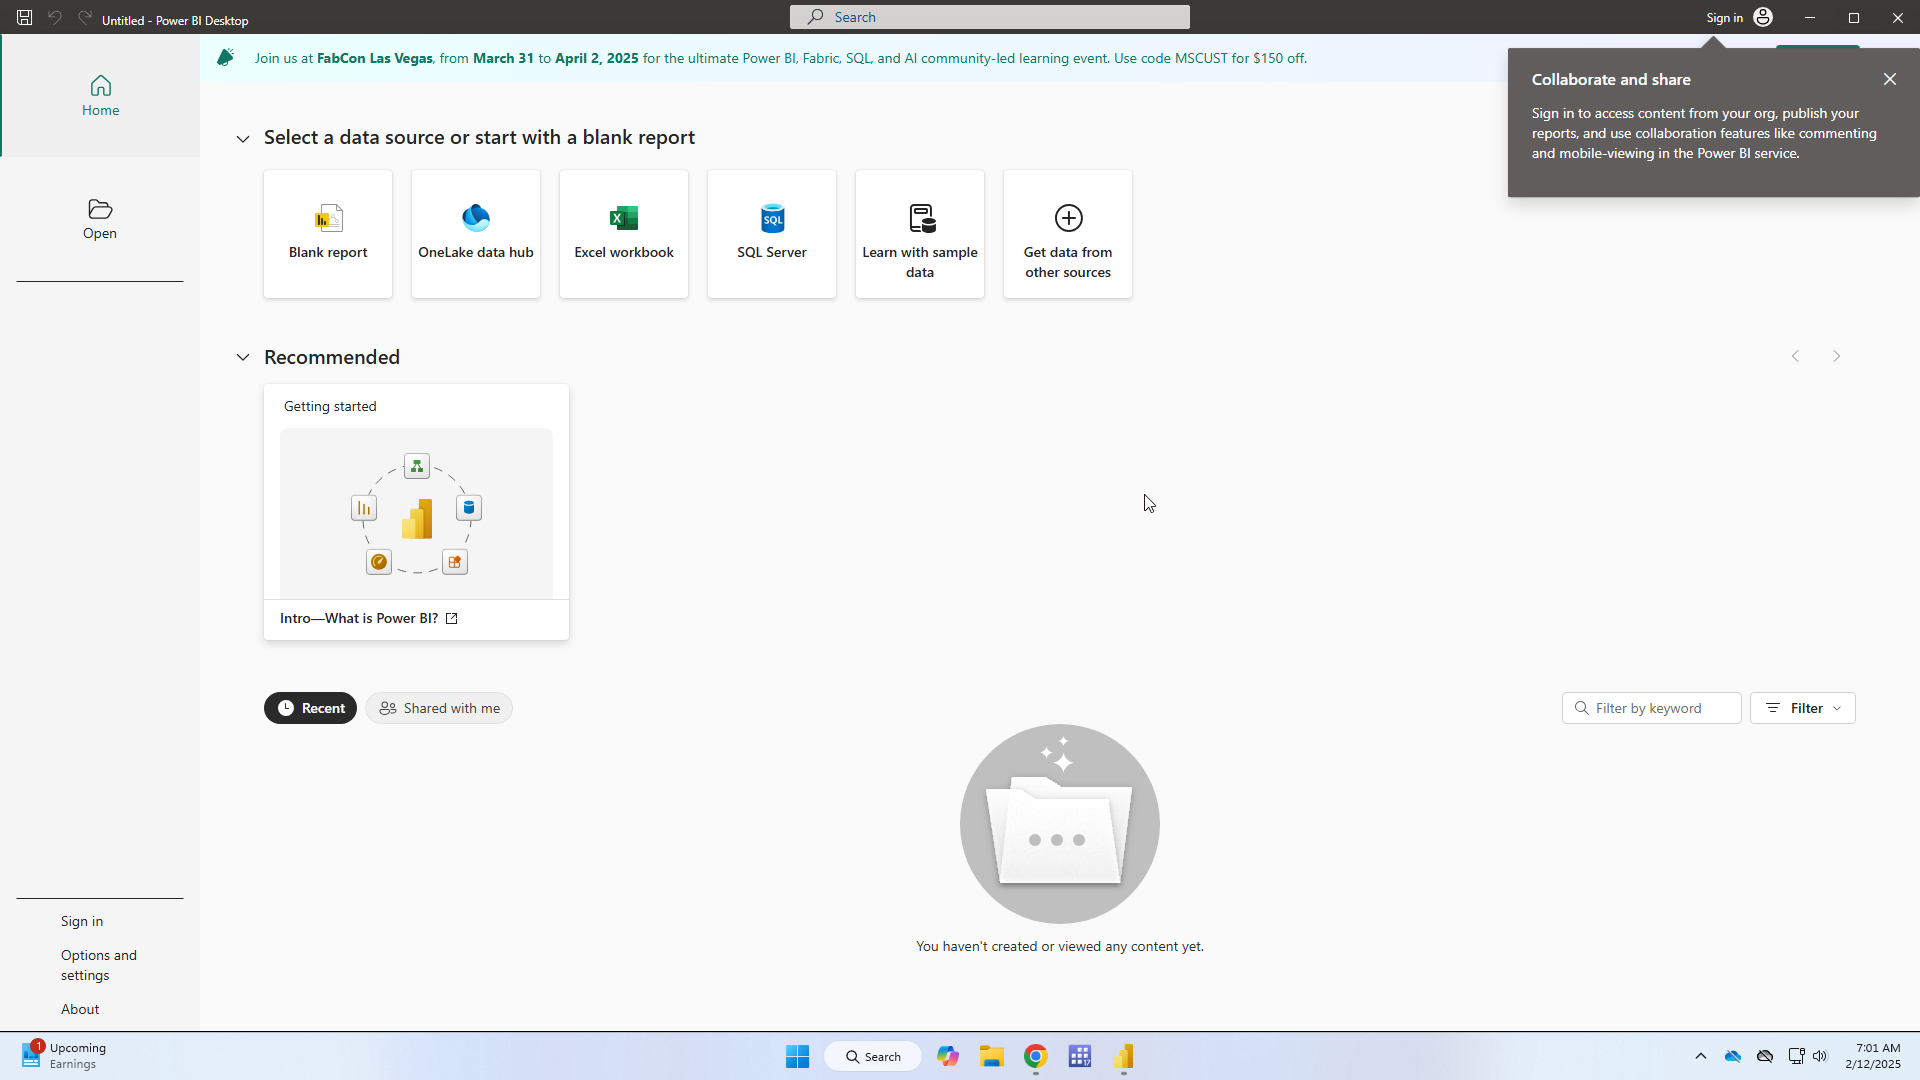
1.4.1 Launch Power BI Desktop
Upon launching, the Welcome Screen appears, providing options to start a new report, open an existing file, or access learning resources.
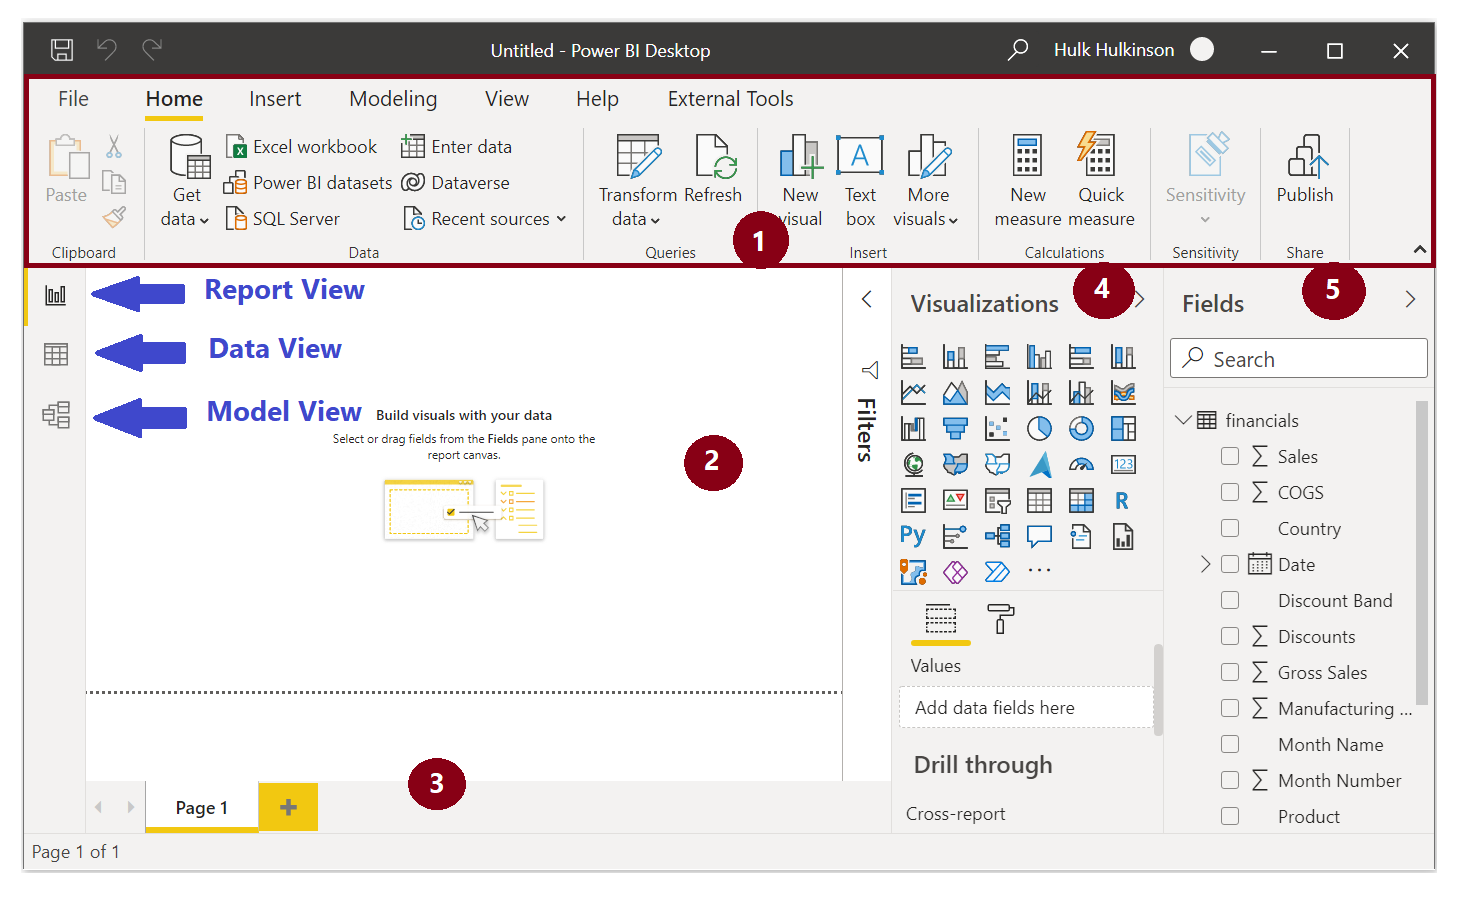
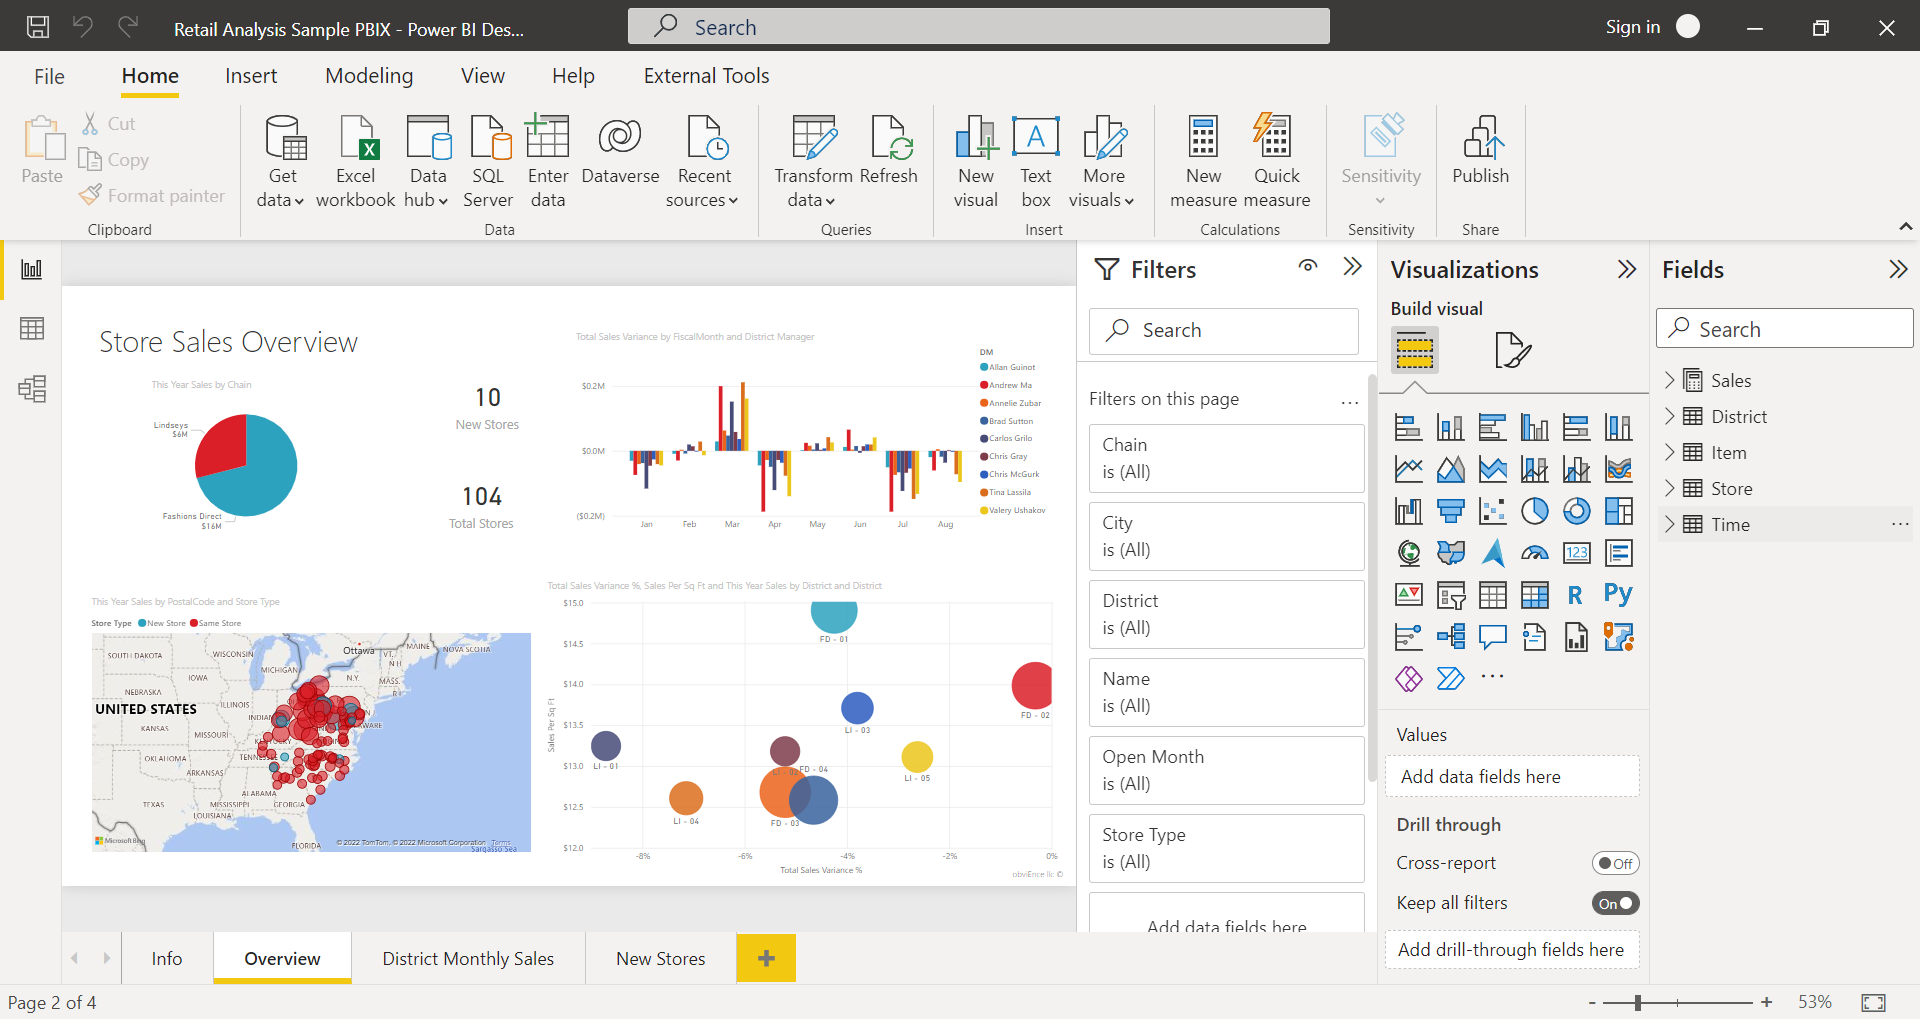
1.4.2 Main Interface Components
Understanding the Power BI environment is essential for creating effective reports and dashboards. Below are the key components of the Power BI interface:
The Power BI interface consists of several key sections:
2. Report View (Main Canvas Area)
The Report View is where users create and design interactive reports by adding visuals such as charts, graphs, and tables.
- By using the icons in the left navigation pane, you can switch between the following views:
-
Report View: For creating and editing reports.
-
Data View: For viewing and modifying your dataset.
- Model View: For managing relationships between tables in your data model.
-
Report View: For creating and editing reports.
- Users can drag and drop fields onto the canvas to generate visualizations.
Data View
The Data View provides a tabular representation of the data loaded into Power BI.
- Users can inspect raw data, review table structures, and verify data types.
- It allows adding calculated columns using DAX (Data Analysis Expressions).
Model View
The Model View enables users to create relationships between tables.
- Users can drag and connect fields to define relationships.
- Relationships help in combining data from multiple tables for analysis.
3. Pages Tab
The Pages Tab is located at the bottom of the canvas.
- The report view consists of multiple pages (similar to slides in PowerPoint), allowing users to create structured reports.
- Use it to select, add, or manage report pages.
- Each page can contain a unique set of visualizations, allowing for organized and structured reports.
Publishing and Saving Reports
Once a report is created, users can:
- Click Save to store the file as a
.pbixfile for future editing. - Click Publish to share the report on Power BI Service (requires a Microsoft Power BI account).