2 Connecting To Data Sources
Power BI provides extensive connectivity options, enabling users to import and analyze data from various sources. Establishing connections to these data sources is the first step in building powerful visualizations and performing data analysis. Whether working with on-premise databases, cloud services, flat files, or APIs, Power BI simplifies the data extraction process to ensure seamless integration and real-time analytics.
With Power BI, users can connect to structured and unstructured data from multiple sources, clean and transform the data, and build insightful reports. Understanding how to connect to various data sources is essential for leveraging Power BI’s full potential in business intelligence and data visualization.
2.1 Supported Data Sources in Power BI
Power BI provides extensive connectivity options, enabling users to import and analyze data from various sources. These data sources are categorized into different types, including databases, cloud services, files, big data platforms, and APIs.
1. Flat Files
Users can also import data from commonly used file formats, making it easier to analyze structured datasets stored locally or on network drives.
- Excel (.xlsx, .xls): The most widely used file format for structured data.
- CSV (.csv): Plain-text files containing tabular data separated by commas.
- XML (.xml): Hierarchical structured data format.
- JSON (.json): Lightweight data format widely used in APIs and web services.
- Parquet (.parquet): Columnar storage file format optimized for large datasets.
2. Databases
Power BI supports connectivity to a variety of relational and non-relational databases, including:
- SQL Server: On-premise and cloud-based databases for structured data analysis.
- MySQL: Open-source database commonly used for web applications.
- PostgreSQL: Advanced relational database supporting complex queries.
- Oracle Database: Enterprise-level database known for its scalability and security.
- IBM DB2: A high-performance database for large-scale data applications.
- Amazon Redshift: Cloud-based data warehouse optimized for analytical processing.
- Google BigQuery: Serverless, scalable, and cost-effective multi-cloud data warehouse.
3. Cloud Services
Power BI integrates with various cloud platforms and services, allowing users to analyze and visualize cloud-stored data. Some of the commonly used services include:
- Azure SQL Database: Cloud-hosted SQL database for scalable and managed data processing.
- Azure Data Lake: Storage service for big data analytics.
- Google Analytics: Web analytics platform for tracking website and application performance.
- Amazon S3: Cloud storage for large-scale data storage and retrieval.
- Salesforce: Customer relationship management (CRM) software integration.
- SharePoint Online: Cloud document management and collaboration platform.
4. Big Data Platforms
Power BI supports big data technologies, enabling users to work with large-scale datasets from distributed computing environments.
- Hadoop: Open-source framework for distributed storage and processing of large datasets.
- Spark: In-memory computing engine for big data analytics.
- Snowflake: Cloud-based data platform offering storage and analytics.
- Databricks: Unified data analytics platform optimized for Apache Spark.
5. Online Services
Power BI allows users to extract data from various online platforms and business intelligence services, making it easy to integrate external analytics tools.
- Microsoft Dynamics 365: Business application platform with CRM and ERP functionalities.
- Facebook & LinkedIn Ads: Analyzing social media advertising performance.
- MailChimp: Email marketing analytics and campaign tracking.
- Google Sheets: Cloud-based spreadsheet software for collaborative data analysis.
6. APIs & Custom Data Sources
For advanced data integration, Power BI enables users to connect to custom data sources using APIs and scripting languages.
- REST APIs: Fetching data from web services and third-party applications.
- OData Feed: Open protocol allowing data access via web-based queries.
- Web Scraping: Extracting data from web pages for analysis.
- R & Python Scripts: Importing and manipulating data using scripting languages.
2.2 Importing Data from Excel, CSV, Google Sheets, SQL Server, and Online Services
Power BI allows users to import data from various sources, including Excel, CSV files, Google Sheets, SQL Server, and online services. Importing data is the first step in data analysis and visualization, enabling users to work with structured datasets, transform data, and create interactive reports. This guide explains how to import data from these common sources and the step-by-step process involved.
2.2.1 Importing Data from Excel
Excel files are one of the most commonly used data sources in Power BI. Users can import data from structured tables, named ranges, or entire sheets.
Steps to Import Data from Excel in Power BI Desktop
- Open Power BI Desktop.
- Click on Home → Get Data.
- Select Excel from the list and click Connect.
- Browse and select the desired .xlsx or .xls file.
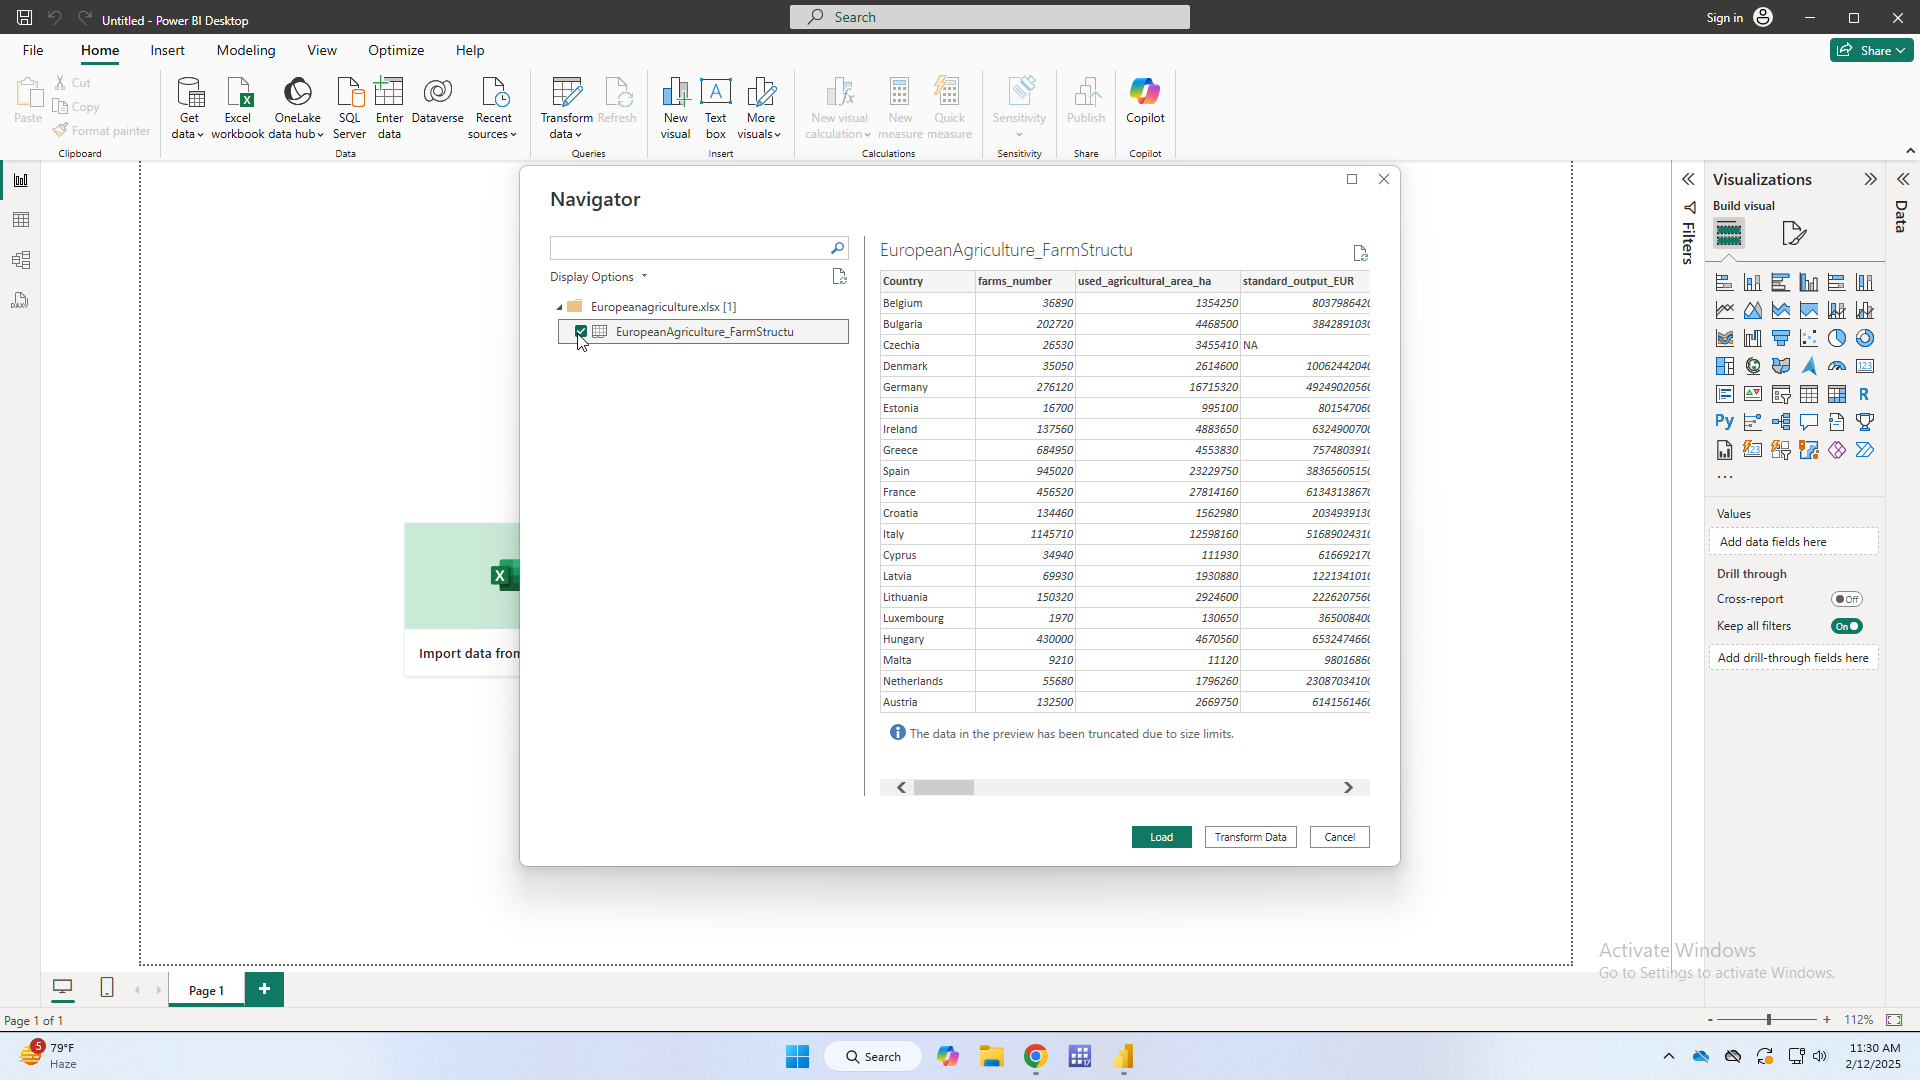
- Power BI will display available sheets and tables in the Navigator window.
- Select the required table or sheet and click Load to import the data into Power BI.
- If transformations are needed, click Transform Data to open Power Query Editor for cleaning and shaping the data before loading.
2.2.2 Importing Data from CSV Files
CSV (Comma-Separated Values) files are widely used for storing tabular data. Power BI provides easy integration with CSV files.
Steps to Import Data from CSV in Power BI Desktop
- Open Power BI Desktop.
- Click Home → Get Data → Text/CSV.
- Browse and select the desired .csv file.
- Click Open to load the data into Power BI.
- The Navigator window will display a preview of the data.
- Click Load to import the data or Transform Data for cleaning and formatting.
2.2.3 Importing Data from Google Sheets
Google Sheets is a cloud-based spreadsheet application that Power BI can connect to via a web link.
Steps to Import Data from Google Sheets in Power BI Desktop
- Open the Google Sheet containing the data.
- Click File → Share → Get Link and change the access to “Anyone with the link.”
- Copy the shared link and replace the ending
/editwith/gviz/tq?tqx=out:csv. - Open Power BI Desktop.
- Click Home → Get Data → Web.
- Paste the modified Google Sheets URL into the Web URL field and click OK.
- Click Load to import the data into Power BI.
- If necessary, click Transform Data to clean and format the data.
2.2.4 Importing Data from SQL Server
SQL Server is a powerful database system used by organizations for storing large volumes of structured data. Power BI provides direct connectivity to SQL Server databases.
Steps to Import Data from SQL Server in Power BI Desktop
- Open Power BI Desktop.
- Click Home → Get Data → SQL Server.
- Enter the Server Name and Database Name.
- Choose the connection mode:
- Import Mode: Loads data into Power BI for analysis.
- DirectQuery Mode: Keeps data in the database and retrieves updates dynamically.
- Click OK to proceed.
- In the Navigator window, select the required tables or views.
- Click Load to import the data or Transform Data to modify it before loading.
2.2.5 Importing Data from Online Services
Power BI can connect to various online services such as Google Analytics, SharePoint Online, Salesforce, Microsoft Dynamics 365, and more.
Steps to Import Data from Online Services in Power BI Desktop
- Open Power BI Desktop.
- Click Home → Get Data → More.
- Under the Online Services category, select the desired service (e.g., Google Analytics, SharePoint Online List, Salesforce Objects).
- Click Connect.
- Enter your credentials and authorize Power BI to access the service.
- In the Navigator window, browse and select the required dataset.
- Click Load to import the data into Power BI.
2.2.6 Best Practices for Importing Data in Power BI
- Use Structured Data: Ensure that Excel sheets, CSV files, and SQL queries return well-structured datasets.
- Optimize Data for Performance: Avoid importing unnecessary columns and large datasets when possible.
- Use Data Transformations: Utilize Power Query Editor to clean and shape data before loading it into Power BI.
- Select the Right Connection Mode: Use Import Mode for offline analysis and DirectQuery Mode for real-time updates.
2.2.7 Saving Power BI report (.PBIX and .PBIT)
In Power BI, .PBIX and .PBIT files serve different purposes. Below is a detailed comparison:
PBIX (Power BI Desktop File)
- A standard Power BI report file that contains:
- Data model (imported data)
- Queries
- Reports and visuals
- DAX measures and relationships
- When saving a report in Power BI Desktop, it is stored as a
.PBIXfile. - Suitable for working reports that include both data and report design.
PBIT (Power BI Template File)
- A Power BI template file that contains:
- Report structure (visuals, layouts, DAX measures)
- Queries and relationships
- ❌ No actual data (only metadata and structure)
- Used when you want to share a report layout without data, allowing others to use their own dataset.
- Ideal for creating reusable report templates.
Comparison Table
| Feature |
.PBIX (Report File) |
.PBIT (Template File) |
|---|---|---|
| Contains Data? | ✅ Yes | ❌ No |
| Editable? | ✅ Yes | ✅ Yes |
| Used for Sharing Reports? | ✅ Yes, with data | ✅ Yes, as a template |
| File Size | Larger (includes data) | Smaller (no data) |
When to Use Which?
-
Use
.PBIXif you want to save and work on a full report with data. -
Use
.PBITif you want to create a template that others can use with different datasets.
2.3 Data Transformation with Power Query Editor
Power Query Editor is a powerful tool within Power BI that allows users to transform raw data into a structured format suitable for analysis. It provides a user-friendly interface for cleaning, shaping, and enhancing data before loading it into Power BI reports.
2.3.1 Accessing Power Query Editor
Power Query Editor can be accessed in Power BI Desktop by:
- Clicking Transform Data in the Home tab after importing data.
- Selecting Edit Queries from the Queries pane.
This opens the Power Query Editor, where users can apply various transformations to the imported data.
2.3.2 Common Data Transformations in Power Query Editor
Power Query Editor provides numerous transformation options, including:
A. Removing Unnecessary Columns and Rows
- Click on a column and choose Remove Columns to eliminate unnecessary data.
- Use Remove Rows options to filter out blank or duplicate records.
B. Changing Data Types
- Ensure that each column has the correct data type (e.g., Date, Text, Number) to prevent errors in calculations.
- Click on a column header → Data Type → Select the appropriate type.
C. Splitting and Merging Columns
- Use Split Column by delimiter (e.g., commas, spaces) to break text into separate columns.
- Use Merge Columns to concatenate multiple columns into one.
D. Filtering and Sorting Data
- Apply filters to display only relevant data by clicking on the dropdown in column headers.
- Sort data in ascending or descending order for better organization.
E. Replacing and Filling Missing Values
- Use Replace Values to substitute unwanted values with a specific entry.
- Use Fill Down/Up to populate missing data based on existing values.
F. Grouping and Aggregating Data
- Use Group By to summarize data based on categories.
- Apply aggregate functions like sum, average, and count on grouped data.
G. Creating Custom Columns
- Use Add Column → Custom Column to create calculated fields using formulas.
- Apply M-language expressions to manipulate data.
2.3.3 Advanced Data Transformations
Power Query Editor also allows for advanced transformations, including:
- Pivoting and Unpivoting Data: Restructure data from wide to long format and vice versa.
- Appending and Merging Queries: Combine data from multiple sources into a single table.
- Creating Conditional Columns: Define rules to categorize data automatically.
2.3.4 Applying and Saving Transformations
Once transformations are complete:
- Click Close & Apply to load the transformed data into Power BI.
- The applied steps are recorded in the Applied Steps Pane, allowing users to modify or undo changes at any time.
2.4 Data Cleaning and Shaping Techniques
Data cleaning and shaping are essential steps in preparing raw data for analysis and visualization in Power BI. Power Query Editor provides various tools to clean, structure, and format data efficiently. Proper data preparation ensures accuracy, consistency, and better insights in reports.
2.4.1 Removing Duplicates
Duplicate records can skew analysis and lead to incorrect insights. Power BI provides an easy way to remove duplicates from datasets.
- Select one or more columns containing duplicate values.
- Click Remove Duplicates under the Home tab.
- Power Query retains only the first occurrence of each duplicate record.
2.4.2 Handling Missing Data
Incomplete datasets can impact report accuracy. Power Query Editor allows users to handle missing data effectively.
- Remove Blank Rows: Deletes empty records from the dataset.
-
Fill Missing Values:
- Use Fill Down or Fill Up to propagate existing values.
- Replace missing values with a default value using Replace Values.
2.4.3 Standardizing Data Formats
Inconsistent data formats can cause errors in calculations and visualizations. Power BI provides several functions to standardize data.
- Convert text to uppercase, lowercase, or proper case using the Format option.
- Trim unnecessary spaces using the Trim function.
- Change date formats to ensure consistency across datasets.
2.4.4 Detecting and Correcting Errors
Incorrect or inconsistent data entries can impact data integrity. Power BI allows users to detect and fix such errors.
- Identify and replace incorrect values using Conditional Columns.
- Use Error Checking tools to highlight and correct anomalies.
- Apply Data Validation Rules to enforce consistency.
2.4.5 Structuring Data for Analysis
Properly structured data makes it easier to analyze and visualize in Power BI. Power Query Editor provides tools to reshape data effectively.
- Unpivot Columns: Converts wide-format data into long-format for better analysis.
- Pivot Columns: Converts categorical data into summary tables.
- Group By: Aggregates data based on categories for efficient reporting.
2.4.6 Splitting and Merging Data
Splitting or merging columns is often required when working with text-based data.
- Split Column: Breaks text into multiple columns based on delimiters (e.g., spaces, commas).
- Merge Columns: Joins multiple columns into a single column.
2.4.7 Transforming Data Types
Ensuring the correct data type prevents calculation and filtering errors in Power BI.
- Click on a column header → Change Data Type → Select the appropriate type (Text, Date, Number, etc.).
- Power Query automatically detects incorrect data types and allows modifications.
2.4.8 Applying and Saving Transformations
Once data is cleaned and structured:
- Click Close & Apply to load the transformed data into Power BI.
- Applied transformations are stored in the Applied Steps Pane, allowing modifications or undoing changes when necessary.